September MLB Most Wins: Dodgers Lead the Model, But the Value Runs Deeper
September MLB Most Wins: Dodgers Lead the Model, But the Value Runs Deeper
Before we move on to September, we can enjoy August for a minute.
Philadelphia finished August 21-7 and won the MLB Most Wins race.
That was a fun result for us because the Phillies became a major part of the story as our Monte Carlo simulation continuously repriced the race throughout the month.
The whole idea behind the Basewinner Simulation Center is that these aren't static predictions. Every day's results change the race. Wins get banked, games disappear from the remaining schedule, and the probability distribution changes.
By the end of August, there was nothing left to simulate.
Philadelphia had won it.
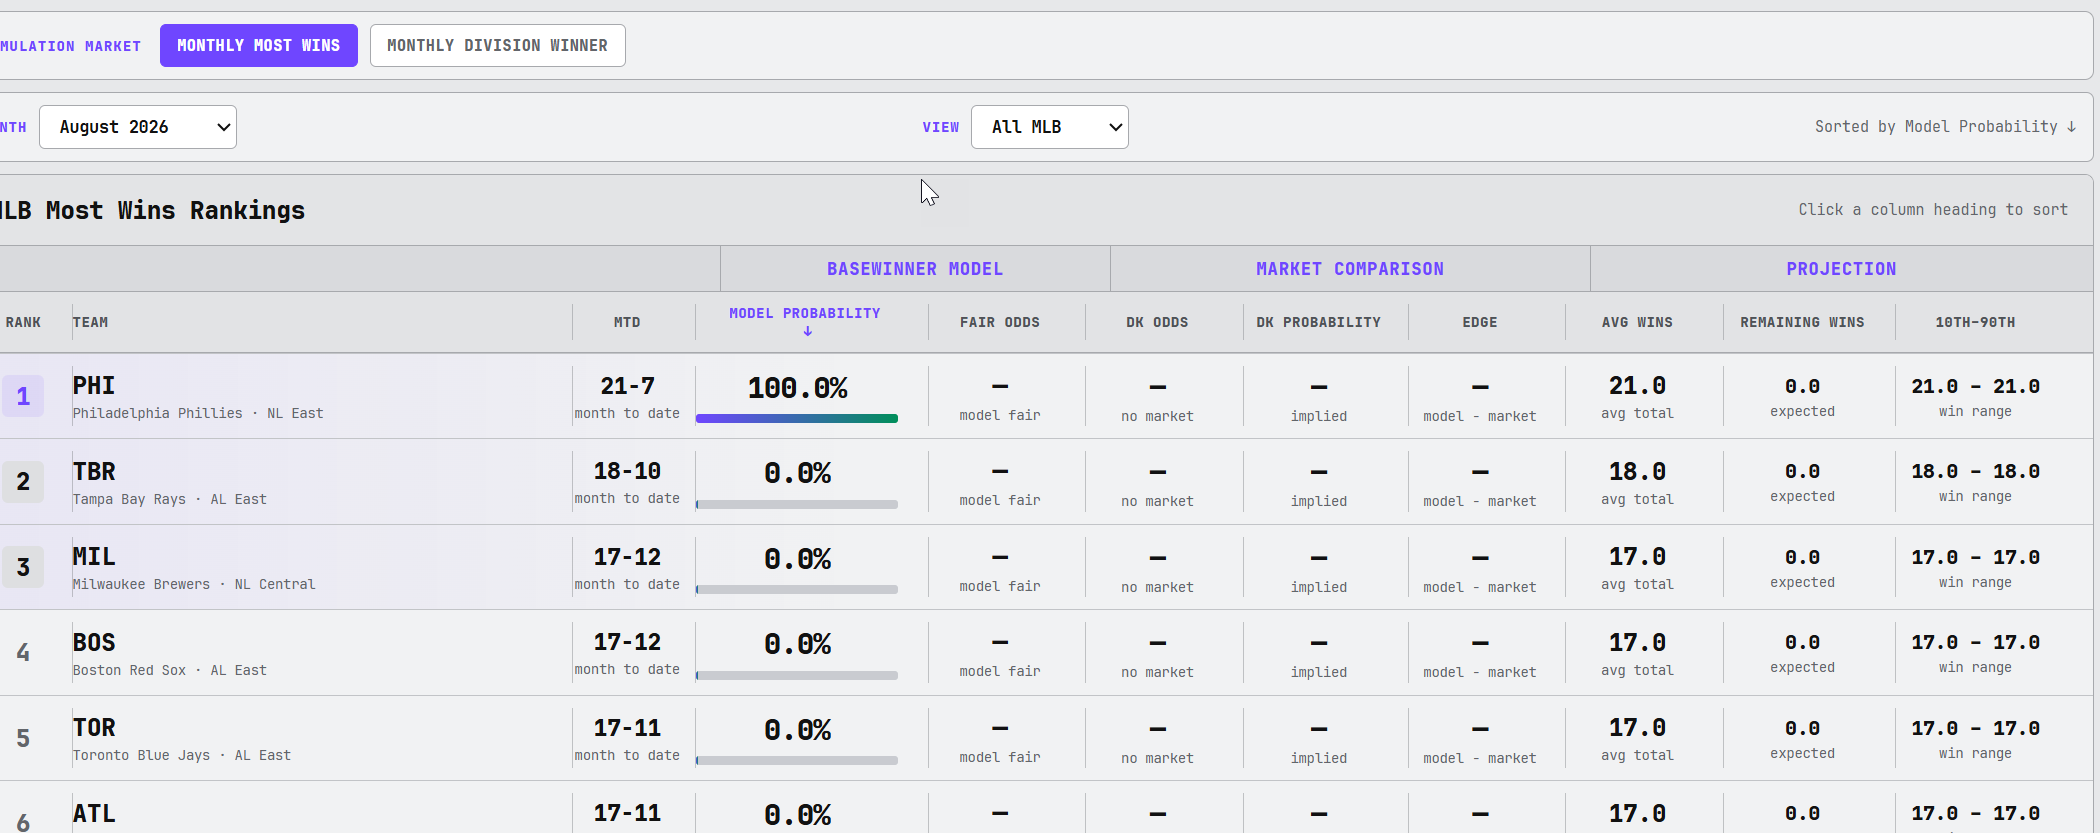
August final: Philadelphia finishes 21-7 and closes the month at 100%.
That was August.
Now everything resets to zero.
And on September 2, we already have some interesting disagreements between the Basewinner model and the market.
The Dodgers Start September as the Clear Favorite
The first September Monte Carlo board has one team well ahead of everyone else:
Los Angeles Dodgers — 30.3%.
That's nearly a one-in-three probability of LAD finishing September with more wins than any other MLB team.
Our 30.3% probability converts to approximately +231 fair odds.
DraftKings is currently offering +320, which implies only a 23.8% probability.
That's a 6.4 percentage-point model edge.
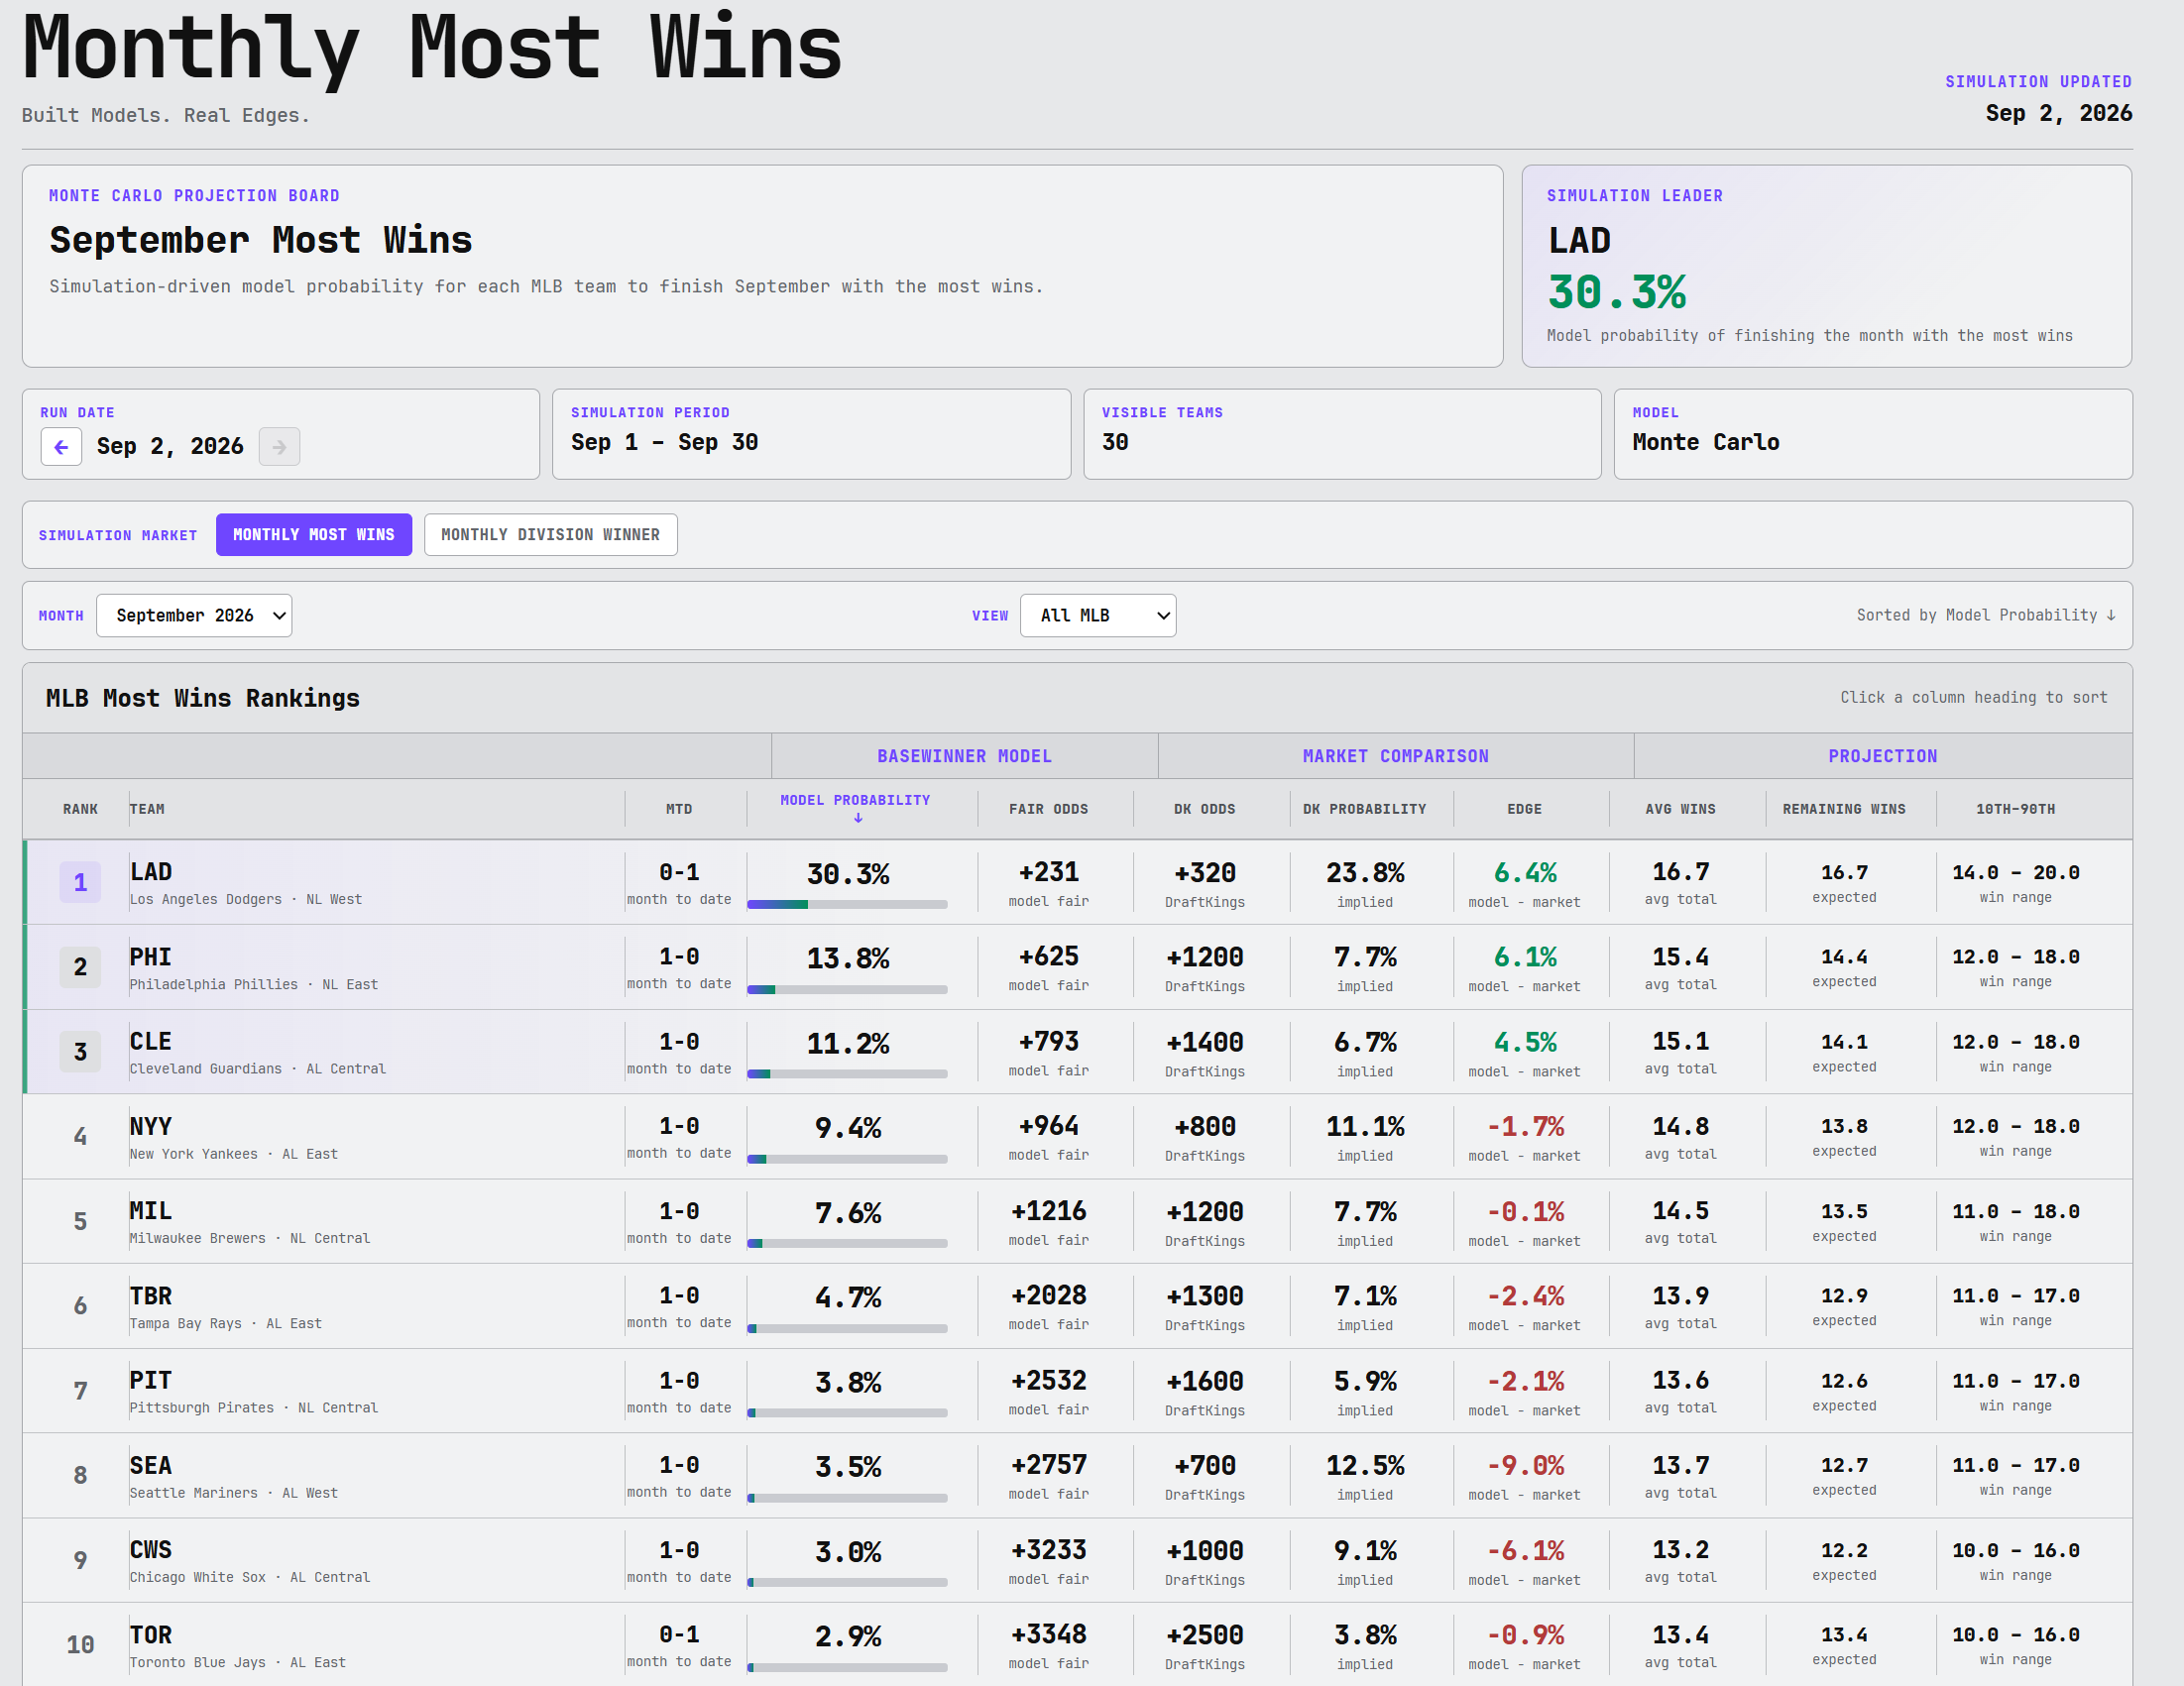
September 2: The Dodgers lead the Basewinner simulation at 30.3%, with Philadelphia and Cleveland emerging as the next two contenders.
The important thing here is that the market and the model don't disagree about who should be favored.
They disagree about how much of a favorite the Dodgers should be.
That's exactly the kind of distinction we're trying to identify with this process.
Philadelphia Is Right Back on the Board
Apparently winning August wasn't enough.
Philadelphia opened September 1-0, and the simulation already gives the Phillies a 13.8% probability of winning the new monthly race.
That equates to approximately +625 fair odds.
DraftKings is dealing +1200.
So despite being a distant second to Los Angeles in raw probability, Philadelphia actually produces almost as large a model-market differential:
13.8% Basewinner vs. 7.7% market implied — a +6.1% edge.
Cleveland is another early standout.
The Guardians are 11.2% in our simulation, equivalent to approximately +793, while DraftKings is offering +1400.
That's another positive differential of 4.5 percentage points.
So our early September watch list starts with three teams:
- LAD: 30.3% | +231 fair | DK +320
- PHI: 13.8% | +625 fair | DK +1200
- CLE: 11.2% | +793 fair | DK +1400
We're not saying that every positive differential automatically becomes a bet.
We're identifying where our probability estimate differs enough from the market that the price deserves attention.
The Model Can Also Tell Us What Not to Bet
Seattle provides the clearest example on the other side.
DraftKings has the Mariners at +700, implying roughly a 12.5% probability of winning September.
Our simulation?
3.5%.
That's approximately +2757 fair odds according to the model.
So while someone looking at the sportsbook board might see Seattle at +700 as an attractive contender, our simulation sees a completely different proposition.
That's a -9.0 percentage-point model-market differential, the largest negative edge among the teams shown at the top of our September board.
This is an important part of probability-based handicapping.
Finding a price that looks big isn't the same thing as finding value.
Now We're Waiting for the Division Markets
There's another September market I'm particularly interested in seeing DraftKings bring back:
Monthly Division Winner.
DraftKings offered these during August, and I think these markets may actually provide more value within the month than the overall Most Wins market.
The reason is pretty straightforward.
To win MLB Most Wins, a team has to beat the entire league.
A division market reduces the competition to four other teams.
Consider Cleveland.
Instead of asking:
Can Cleveland win more games in September than the Dodgers, Phillies, Yankees, Brewers and everybody else in baseball?
We're asking:
Can Cleveland win more September games than the other four AL Central teams?
That's a substantially different market.
And because our simulation is already generating the underlying game-by-game results, we can price both questions.
We can calculate each team's probability of winning the overall monthly race and its probability of winning the monthly race inside its own division.
During August, those division markets produced some very interesting opportunities.
So we're waiting to see if DraftKings posts them again for September.
If they do, we'll get them into the Simulation Center and immediately compare the market prices against the model.
September 2 Gives Us Our Starting Line
This is probably my favorite part of the project.
We're not looking backward three weeks from now and constructing a story around what happened.
We're recording the probabilities now.
September 2:
LAD — 30.3%
PHI — 13.8%
CLE — 11.2%
NYY — 9.4%
MIL — 7.6%
Those numbers are now our starting point.
A week from now, the board could look completely different.
And we'll have the history.
That's what we built the Simulation Center to do: continuously update the probability of an outcome as new information arrives, then compare that probability with the price available in the market.
August gave us a pretty entertaining demonstration.
Philadelphia won the month.
Now we turn the page.
September is live.
And if DraftKings gives us those division markets again, that's where things could get especially interesting.