August MLB Most Wins: Six Days That Flipped the Simulation
August MLB Most Wins: Six Days That Flipped the Simulation
Philadelphia Goes From 22.5% → 10.5% → 52.5%
Before August began, we published our August Most Wins Market: Opening Card.
The process was straightforward: take the Basewinner ratings, simulate the August schedule 2,000 times, convert the results into probabilities and fair odds, and compare those numbers with the DraftKings market.
Our favorite position was Philadelphia.
The Phillies were the Basewinner Star at +1100. The opening simulation gave Philadelphia a 22.5% probability of finishing August with the most wins, producing Basewinner fair odds of approximately +344.
Three weeks later, Philadelphia is 13-5 and leading the race.
But getting from 22.5% to where we are today was anything but a straight line.
And six days in the middle of August provide a great example of what we're trying to do with the new Basewinner MLB Simulation Center.
Rewind to August 15
One of the features I'm most excited about with the Simulation Center isn't a new model or another statistic.
It's the ability to go backward.
We're preserving the daily simulation runs, which means we can look at what the model actually thought at a specific moment rather than reconstructing the story after we already know what happened.
So let's rewind six days.
On August 15, Tampa Bay had exploded out of the gate at 10-2.
The Rays had become the clear favorite in the simulation, winning the August Most Wins race 43.8% of the time.
The Cubs were 10-3 and second at 18.6%.
Philadelphia was 8-5.
And the Phillies' probability had fallen all the way to 10.5%.
Basewinner fair odds: +848.
DraftKings: +2000.
Basewinner Simulation Center — August 15
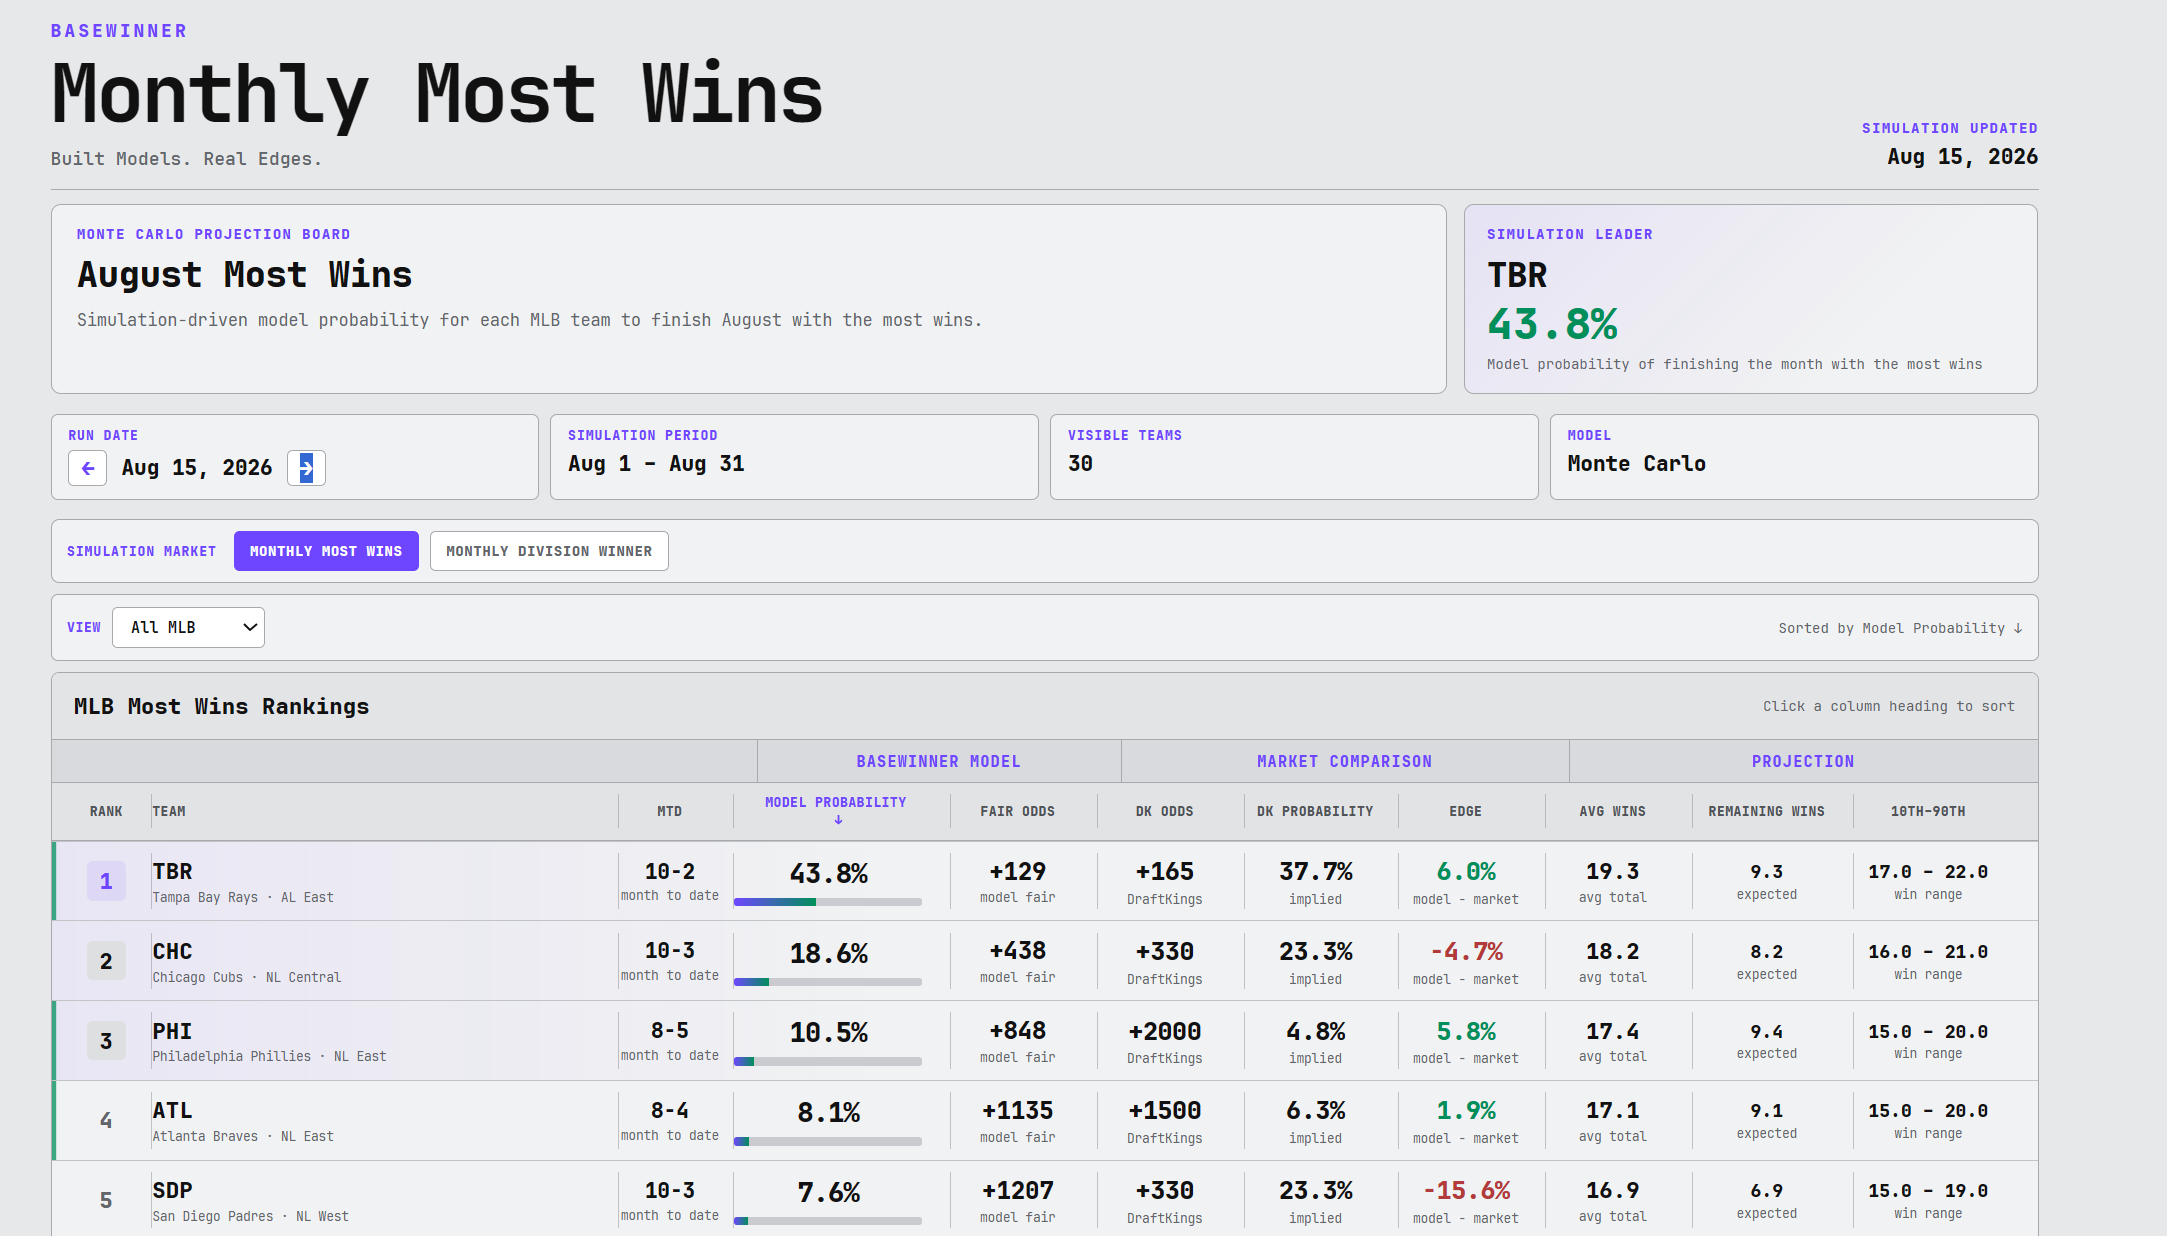
That's an important snapshot.
If we looked only at today's results, it would be easy to tell ourselves that Philadelphia was always destined to lead this race.
The August 15 simulation says otherwise.
At that moment, Tampa Bay was overwhelmingly the most likely winner.
Philadelphia was third.
Then Six Days Changed Everything
Now move the Simulation Center forward to August 21.
Philadelphia has won five straight, moving from 8-5 to 13-5.
Tampa Bay has gone from 10-2 to 12-6.
The Cubs have gone from 10-3 to 12-6.
And the entire probability board has flipped.
Philadelphia now finishes August with the most wins in 52.5% of the latest Basewinner simulations.
Tampa Bay has fallen from 43.8% to 16.3%.
The Cubs have dropped from 18.6% to 9.8%.
Basewinner Simulation Center — August 21
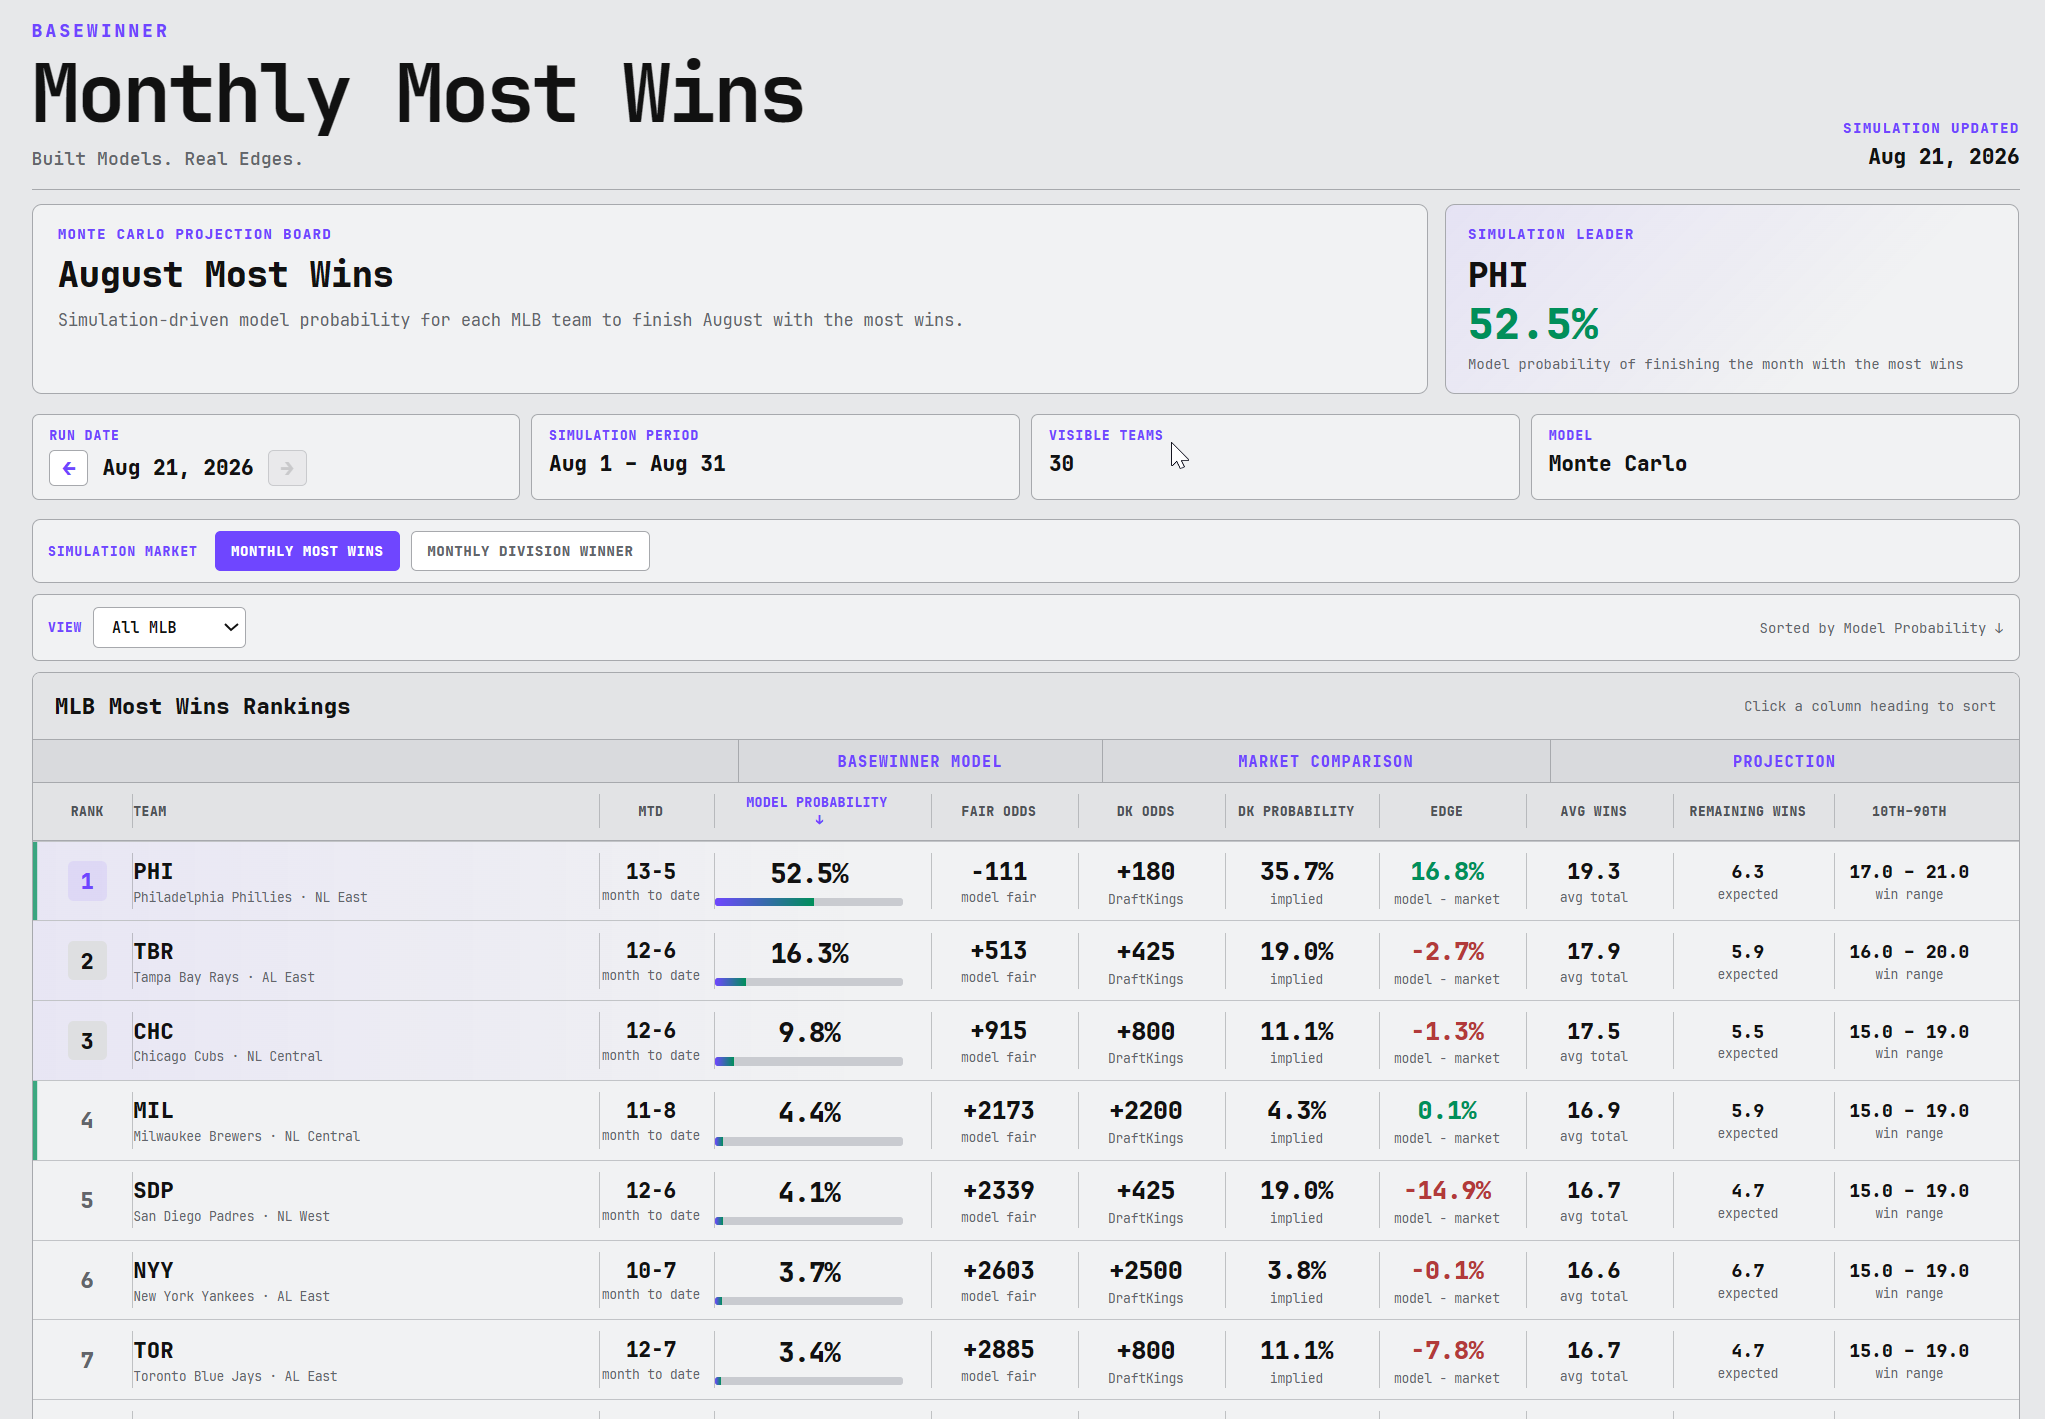
Look at Philadelphia's path:
Before August: 22.5%
August 15: 10.5%
August 21: 52.5%
Same model.
Same process.
Different information.
That's exactly what a probability should do.
What Does the Model Say Now?
The current Philadelphia numbers are striking.
Record: 13-5
Basewinner probability: 52.5%
Basewinner fair odds: -111
DraftKings odds: +180
DraftKings implied probability: 35.7%
Model vs. market edge: +16.8 percentage points
The Phillies' average simulated finish is 19.3 August wins, with a 10th-to-90th percentile range of 17 to 21 wins.
The original +1100 position has obviously developed extremely well.
But here's what's more interesting to me:
After the Phillies have already gone 13-5 and after DraftKings has moved them from +1100 to +180, the latest Basewinner simulation still disagrees with the market.
DraftKings' +180 represents roughly a 35.7% implied probability.
Our simulation has Philadelphia at 52.5%.
August isn't finished.
The Race Behind Philadelphia
The Phillies have created significant separation, but they're not home yet.
The August 21 Simulation Center has the leading contenders at:
Philadelphia — 52.5%
Tampa Bay — 16.3%
Chicago Cubs — 9.8%
Milwaukee — 4.4%
San Diego — 4.1%
New York Yankees — 3.7%
Toronto — 3.4%
Tampa Bay remains the clear second choice, with an average simulated finish of 17.9 wins.
The Cubs project to 17.5.
Philadelphia is at 19.3.
There is still enough baseball remaining for those numbers to move again.
We've already seen how quickly that can happen.
One Big Market Disagreement in the Other Direction
Philadelphia isn't the only interesting number on the board.
Take San Diego.
The Padres are 12-6 in August, and DraftKings has them at +425 to finish with the most wins.
That price implies roughly a 19.0% probability.
Basewinner has San Diego at only 4.1%.
That's a -14.9 percentage-point model-versus-market difference.
It's an excellent example of the distinction we're trying to make with this board.
San Diego is having a very good month.
That doesn't automatically mean +425 is a good price to finish ahead of every other team in baseball.
The standings tell us what has happened.
The sportsbook tells us the price.
The simulation estimates the probability.
The value — or lack of it — comes from comparing the last two.
Revisiting the Opening Card
The other advantage of preserving these simulations is accountability.
We don't have to remember what we liked before August.
We published it.
⭐ Basewinner Star — Philadelphia +1100
The opening simulation had Philadelphia at 22.5%.
Today it's 52.5%.
The path in between, however, might be even more interesting: on August 15, Philadelphia was available at +2000 while the model still gave the Phillies a 10.5% probability.
⭐ Basewinner Value — Atlanta +1200
Atlanta hasn't developed into one of the leading contenders.
That's part of the record too.
👀 Watch List — Toronto +5000
Toronto has played well and is 12-7.
But price matters.
DraftKings has moved Toronto all the way from +5000 to +800, while the current Basewinner probability is only 3.4%.
A team that can be interesting at +5000 can be completely different at +800.
💣 Basewinner Bomb — Athletics +15000
The Athletics were always a true longshot.
They haven't emerged as a serious contender for the overall August crown.
🚫 Basewinner Fade — Texas +900
The opening simulation was substantially below the market on Texas.
The Rangers haven't emerged among the leaders on the August 21 board.
That's the scorecard.
Some positions worked.
Some didn't.
Some changed dramatically.
And that's precisely why recording the original probability and price matters.
A Model Is a Moving Opinion
One of the things this August experiment illustrates beautifully is that a model probability isn't supposed to remain fixed.
It should change when the information changes.
Philadelphia being 22.5% before August and 10.5% on August 15 isn't a contradiction.
And Philadelphia being 52.5% six days later doesn't make the 10.5% number a mistake.
They're answers to the same question at different points in time.
On August 15, Tampa Bay was 10-2 and Philadelphia was 8-5.
On August 21, Tampa Bay is 12-6 and Philadelphia is 13-5.
The number should change.
What we're now able to do with the Simulation Center is preserve those moments and watch the probability evolve with them.
The Model Doesn't Get to Know the Ending
That's ultimately what makes this project interesting to me.
There will be great calls.
There will be bad calls.
There will be favorites that lose and longshots that win.
That's probability.
The goal isn't to come back after the games are over and make the result look obvious.
It's the opposite.
Publish the probability. Record the price. Play the games. Update the data. Run it again.
Then see what we learned.
Philadelphia started August at 22.5% and +1100.
By August 15, it was 10.5% and +2000.
Six days later, it's 52.5% and +180.
And we still don't know how the story ends.
That's exactly the point.
Basewinner probabilities shown are from the Basewinner MLB Simulation Center using 2,000 Monte Carlo simulations. DraftKings prices reflect the market captured by the Basewinner odds process and can change or become unavailable.
Previously: August Most Wins Market: Opening Card