August MLB Division Odds Update: Inside the New Basewinner Simulation Center
August Division Winner Value Board: Two Weeks Later
A First Look at the Basewinner MLB Simulation Center
On August 5, we published our post-trade deadline August Division Winner Value Board.
The idea was straightforward: rebuild the Basewinner team ratings after the trade deadline, simulate the remainder of August 2,000 times, and compare our probabilities with the prices being offered at DraftKings.
Two weeks later, we have actual results to evaluate.
Some of the original positions have performed very well. Some have gone the other direction. And several of these division races have changed dramatically.
But there's another reason for this update.
We've been building something behind the scenes.
Introducing the Basewinner MLB Simulation Center
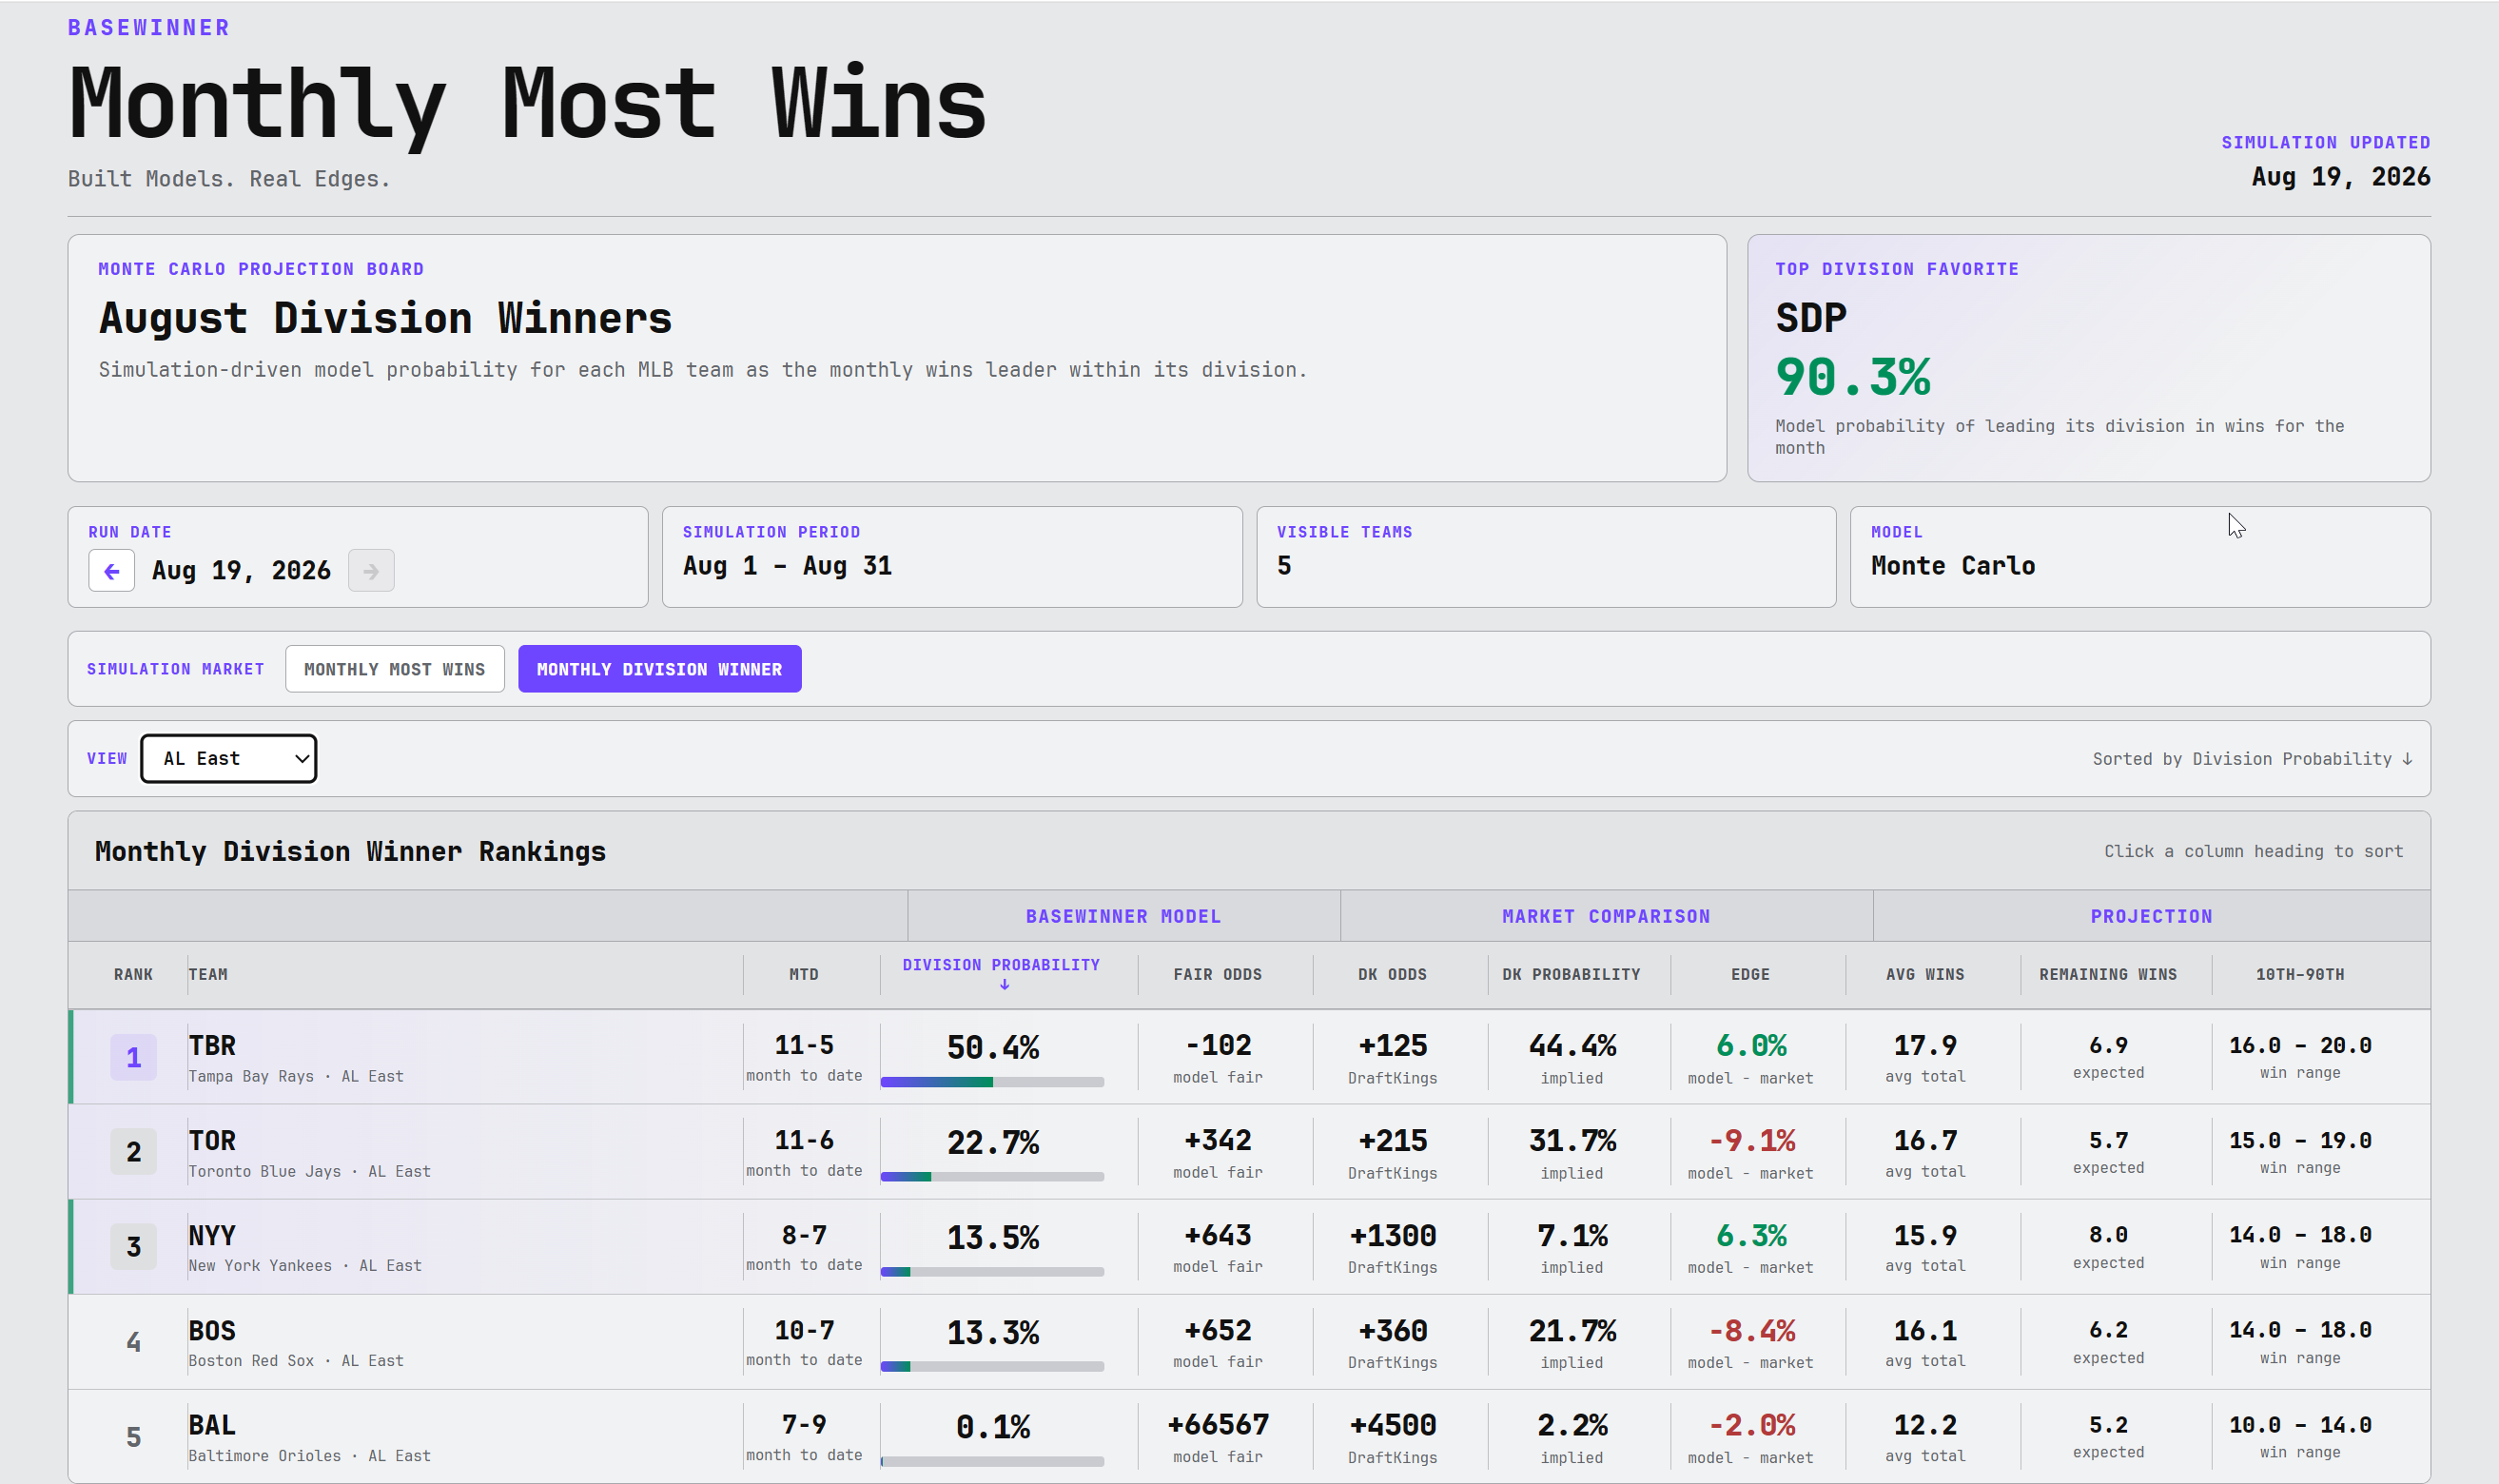
The screenshots in this article are a first look at the new Basewinner MLB Simulation Center.
The goal was to take what had largely been a behind-the-scenes modeling process and build an interface that allows us to follow these simulations as the month develops.
For every team, we can now see its:
Month-to-date record
Monte Carlo probability
Basewinner fair odds
Current DraftKings odds
DraftKings implied probability
Model-versus-market edge
Expected remaining wins
Projected August win total
10th-to-90th percentile simulation range
And because we're saving each simulation run, we can go back through the month and see how these probabilities evolved as actual games were played.
This isn't a new model replacing what we published earlier this month.
It's a better way to see it.
The August 5 Scorecard
It's important not to turn a model update into a victory lap.
The point of publishing probabilities before the games are played is that we can come back later and evaluate them honestly.
On August 5, our six Best Value selections were:
AL East: Yankees +550
AL Central: Guardians +340
AL West: Astros +180
NL East: Phillies -110
NL Central: Brewers +425
NL West: Dodgers +260
There have already been some major changes.
Cleveland has struggled badly and the original Guardians position has taken a hit.
The Dodgers were one of the most interesting calls on the August 5 board. Los Angeles had started August 0-4, but the simulations still made the Dodgers the most likely team to win the NL West month and showed substantial value at +260.
That hasn't materialized. San Diego has gone in the opposite direction and has taken command of the race.
That's part of modeling.
But at the other end of the board is Philadelphia.
Philadelphia: From -110 to an 89% Simulation Probability
The Phillies were our strongest division edge on August 5.
Philadelphia was 4-0 at the time, and our simulations gave the Phillies a 69.8% probability of posting the best August record in the NL East.
Basewinner fair odds were -231.
DraftKings was offering -110.
That 17.42-percentage-point difference between our probability and the probability implied by the DK price was the largest positive discrepancy on the entire August 5 division board.
Fast forward to August 19.
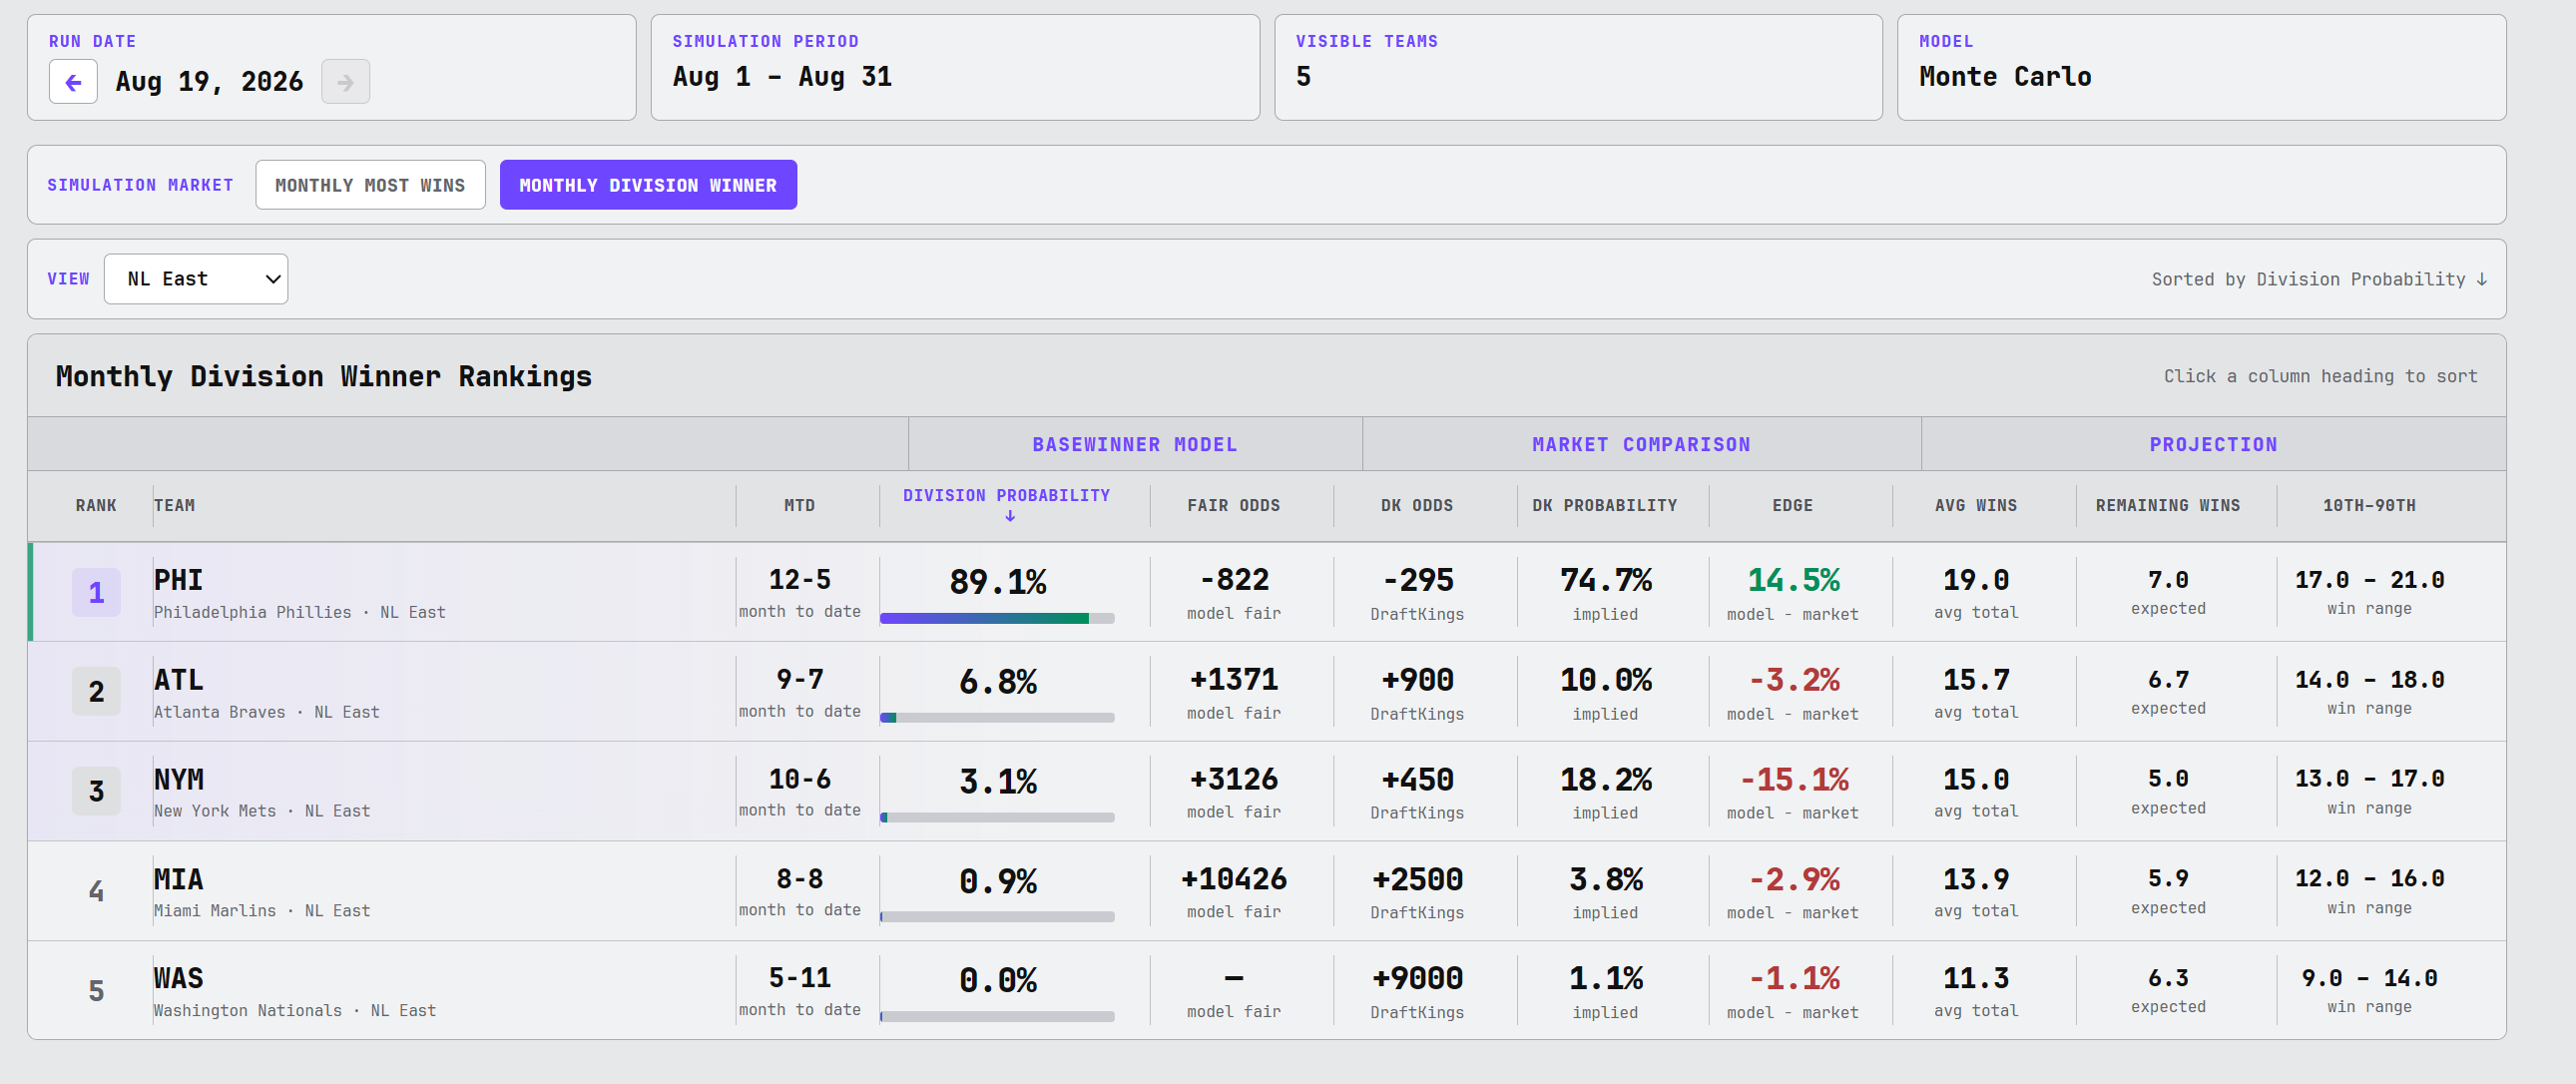
Philadelphia is now 12-5.
And after rerunning the Monte Carlo simulation with the games that have actually been played, Basewinner now gives Philadelphia an 89.1% probability of finishing with the NL East's best August record.
That's approximately -822 fair odds.
DraftKings is -295.
So while the original -110 position has obviously moved substantially in our favor, what's interesting is that the updated simulation still sees Philadelphia's probability as higher than the current market price implies.
Philadelphia is also an important team for another reason.
The Phillies weren't just one of our favorite August division positions. They also showed up prominently in our Overall Most Wins simulations.
We'll come back to that market in the next update.
AL West: This Is What the Simulation Center Is Built For
If Philadelphia shows what happens when a position begins separating from the field, the AL West shows the opposite.
This is a race.
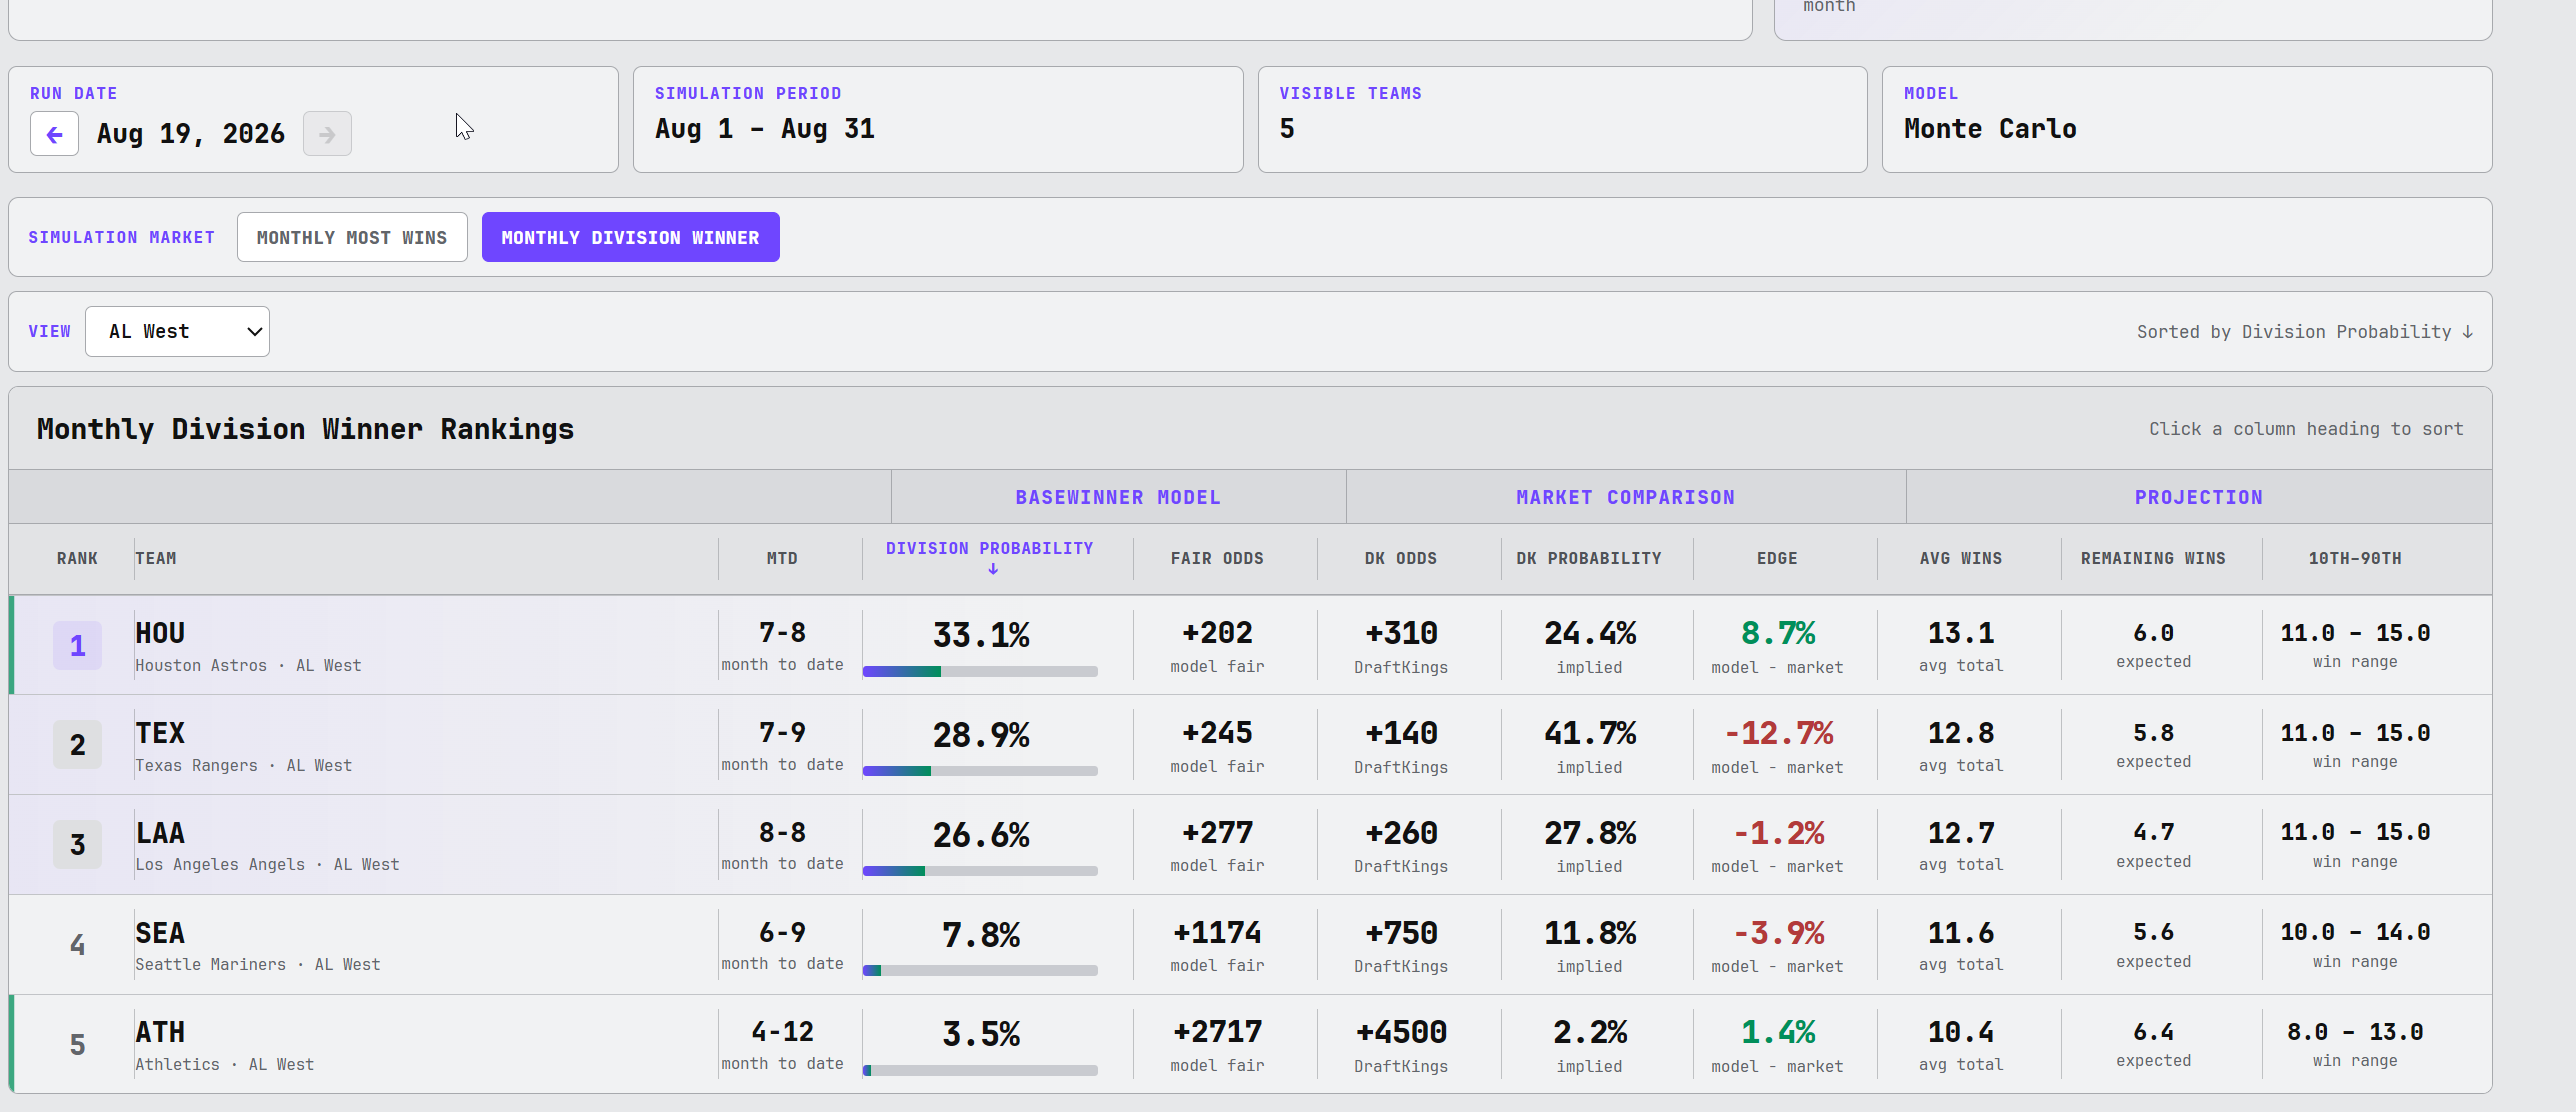
Houston is only 7-8 in August, but the Simulation Center still gives the Astros the highest probability of finishing with the division's best monthly record at 33.1%.
Texas is right behind at 28.9%.
The Angels are at 26.6%.
That's essentially a three-team race.
But the DraftKings prices tell a different story.
Houston is available at +310, an implied probability of 24.4%.
Texas is only +140, implying 41.7%.
Our simulations don't see anything close to that degree of separation.
Basewinner makes Houston approximately +202 fair, while Texas comes in around +245.
That makes Houston one of the more interesting remaining model-versus-market discrepancies on the board, while the current Texas price requires bettors to pay for a probability the simulation isn't producing.
This is one of the reasons we wanted to build the Simulation Center.
Looking at standings alone, Houston's 7-8 record doesn't jump off the page.
Looking only at sportsbook odds, Texas appears to be the obvious favorite.
The simulation gives us another way to evaluate the race: take what's already happened, combine it with our team ratings and remaining schedule, simulate what's left, and then compare the resulting probabilities with the market.
Other August 19 Discrepancies
There are several other spots worth watching.
The Chicago White Sox are particularly interesting in the AL Central. Basewinner gives Chicago a 28.1% probability, compared with approximately 15.4% implied by the +550 DraftKings price.
In the NL Central, Milwaukee remains interesting. The Brewers were our August 5 Best Value at +425 and remain a positive model-versus-market discrepancy at +390.
And despite the way the AL East has developed, the Yankees remain a long-shot discrepancy. Basewinner puts New York at 13.5%, while +1300 implies only about 7.1%.
These aren't guarantees.
They're probability disagreements.
And that's ultimately what we're trying to identify.
The Market Is Starting to Disappear
There's another interesting development as we get deeper into August.
DraftKings is beginning to remove teams — and in some cases markets — as the races become increasingly decided.
The NL West is the clearest example.
San Diego's 12-5 August has pushed the Padres to a 90.3% Basewinner simulation probability, and the DraftKings monthly division market is no longer available on our latest pull.
That creates an interesting feature of the Simulation Center going forward.
Basewinner can continue simulating every team even after a sportsbook stops posting a price.
As the month progresses, the betting market gets smaller.
The simulation doesn't.
Where We're Going With This
This is really the part we're most excited about.
The Simulation Center is still something we're building and expanding.
Monthly Most Wins and the division markets are the beginning.
The larger goal is to create a place where Basewinner simulations, probabilities, market prices and historical results can be tracked together — allowing us to see not only what the model thinks today, but how that opinion changed and why.
For now, consider these screenshots a preview.
And there's another board we need to revisit.
Next up: August Overall Most Wins.
Philadelphia was one of the teams we liked there as well.
Tomorrow we'll open that simulation and see where the race stands.
Basewinner probabilities shown are from the August 19, 2026 simulation update using 2,000 Monte Carlo simulations. DraftKings prices reflect the market captured by the Basewinner odds process and may change or become unavailable. The market discussed is Most Regular Season Wins in August within each division, not the season-long MLB division winner market.